How time valuation relates to asset pricing
The risk-free rate is the depreciation of life expectancy with a premium for volatility
Transactions of capital goods in the real economy happen because different people have different views on the value of a capital good (or free cash flows). The individual value perception of a capital good is driven by (1) a plan (the expected future growth of the existing cashflows and the required investment rate), (2) the predictability of these cashflows and (3) the time perspective of the individual (time value of time). The value perception of an individual can be modelled with existing corporate finance techniques (like the net present value method), however we might want to reconsider the meaning of both the risk premium (equity premium) and the risk-free rate, that currently may not align too well with the dynamics in the real economy.
As an individual looks further into the future, she will less likely be alive and therefore she will value present time over future time based on her chances on survival. For example, imagine a person that has a 20% chance on dying every year. She will value next year at 80% compared to the value of this year, the year thereafter at 64% etcetera. Any given year i years into the future will be worth (1-r)^i for her, equal to her chances on survival. In this example r represents the chance on dying every year.
Young people that live a healthy and safe life have longer expected remaining lifetimes than old people or young people that live an adventurous life or live in a dangerous environment. We can possibly model the expected remaining lifetime (T(t)) as Brownian motion, with the depreciation rate of the expected remaining lifetime (δT) as (negative) drift. Both the drift and the volatility (σT^2) of the expected remaining lifetime are driven by the behaviour and environment of the individual and increase as she gets older. These dynamics do not fundamentally differ for companies that aim for acquisitive growth, except that the drift now reflects the (annual) chance on default and both the drift and the volatility are driven by (1) the sector dynamics and (2) the behaviour (like financial leverage) of the company. Based on this interpretation the risk-free rate in fact represents the “time value of time” of an investor instead of the return on an investment opportunity in a riskless asset.
The expected growth reflects the knowledge of the buyer with a discount for unpredictability
With this individual time value of time in mind the company (or individual or investor) observes a capital good or a free cash flow (both referred to as “asset”). Based on its own knowledge and specific sector dynamics the company projects a growth and required investment rate curve on the present free cashflow to estimate the expected future free cashflows. In analogy with the interest rate curve this also might be well modelled with Brownian motion, wherein the drift represents the expected future growth and the volatility reflects the level of unpredictability.
Net present value and the financial capital markets
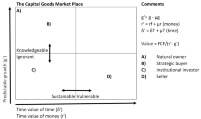
If we now simplify both curves by assuming both the risk-free rate and the future expected growth constant over time and by modelling volatility as a premium on the risk-free rate and a discount on the expected future growth than this yields a formula equal to the well-known net present value formula that we obtain when we summarise the expected future cashflows to infinity. The difference is that the risk premium r now represents the sum of a discount μg regarding unpredictability of future growth and a premium μr regarding the volatility of the “time value of time” that is applicable to the buyer’s situation. Secondly, the risk-free rate represents the depreciation on the expected remaining lifetime of the buyer and not the return on an investment opportunity in a riskless asset. In formula we can write the following.
Perhaps this interpretation can help explaining the “equity premium puzzle” and the “risk-free rate puzzle”. The figure below shows how different organisations have different perspectives on the value of an asset. Investors in the left-upper corner attribute a high value to a specific asset and investors in the right-bottom corner attribute a low value to this asset. It shows that pension funds (C) for example should be more risk-neutral than highly-levered companies and trade buyers (B) have an advantage regarding growth and predictability.

